Example Agents
Disk Space Errors
df -h to see which partition is full, then hunting through directories
with du commands to find what’s consuming all the space. Maybe it’s log files
that weren’t rotated properly. Maybe a backup process went rogue. Maybe someone’s
script started dumping debug files everywhere.
Every single disk space incident follows the same forensic pattern, yet here you
are at 4am, manually typing the same commands while your production systems are
grinding to a halt.
This is the kind of toil that keeps SREs up at night, literally.
The investigation is completely systematic, the data sources are predictable,
and the triage steps never change. It’s the perfect candidate for automation.
Example Alert
Here is an example PagerDuty disk space alert our Agent will investigate: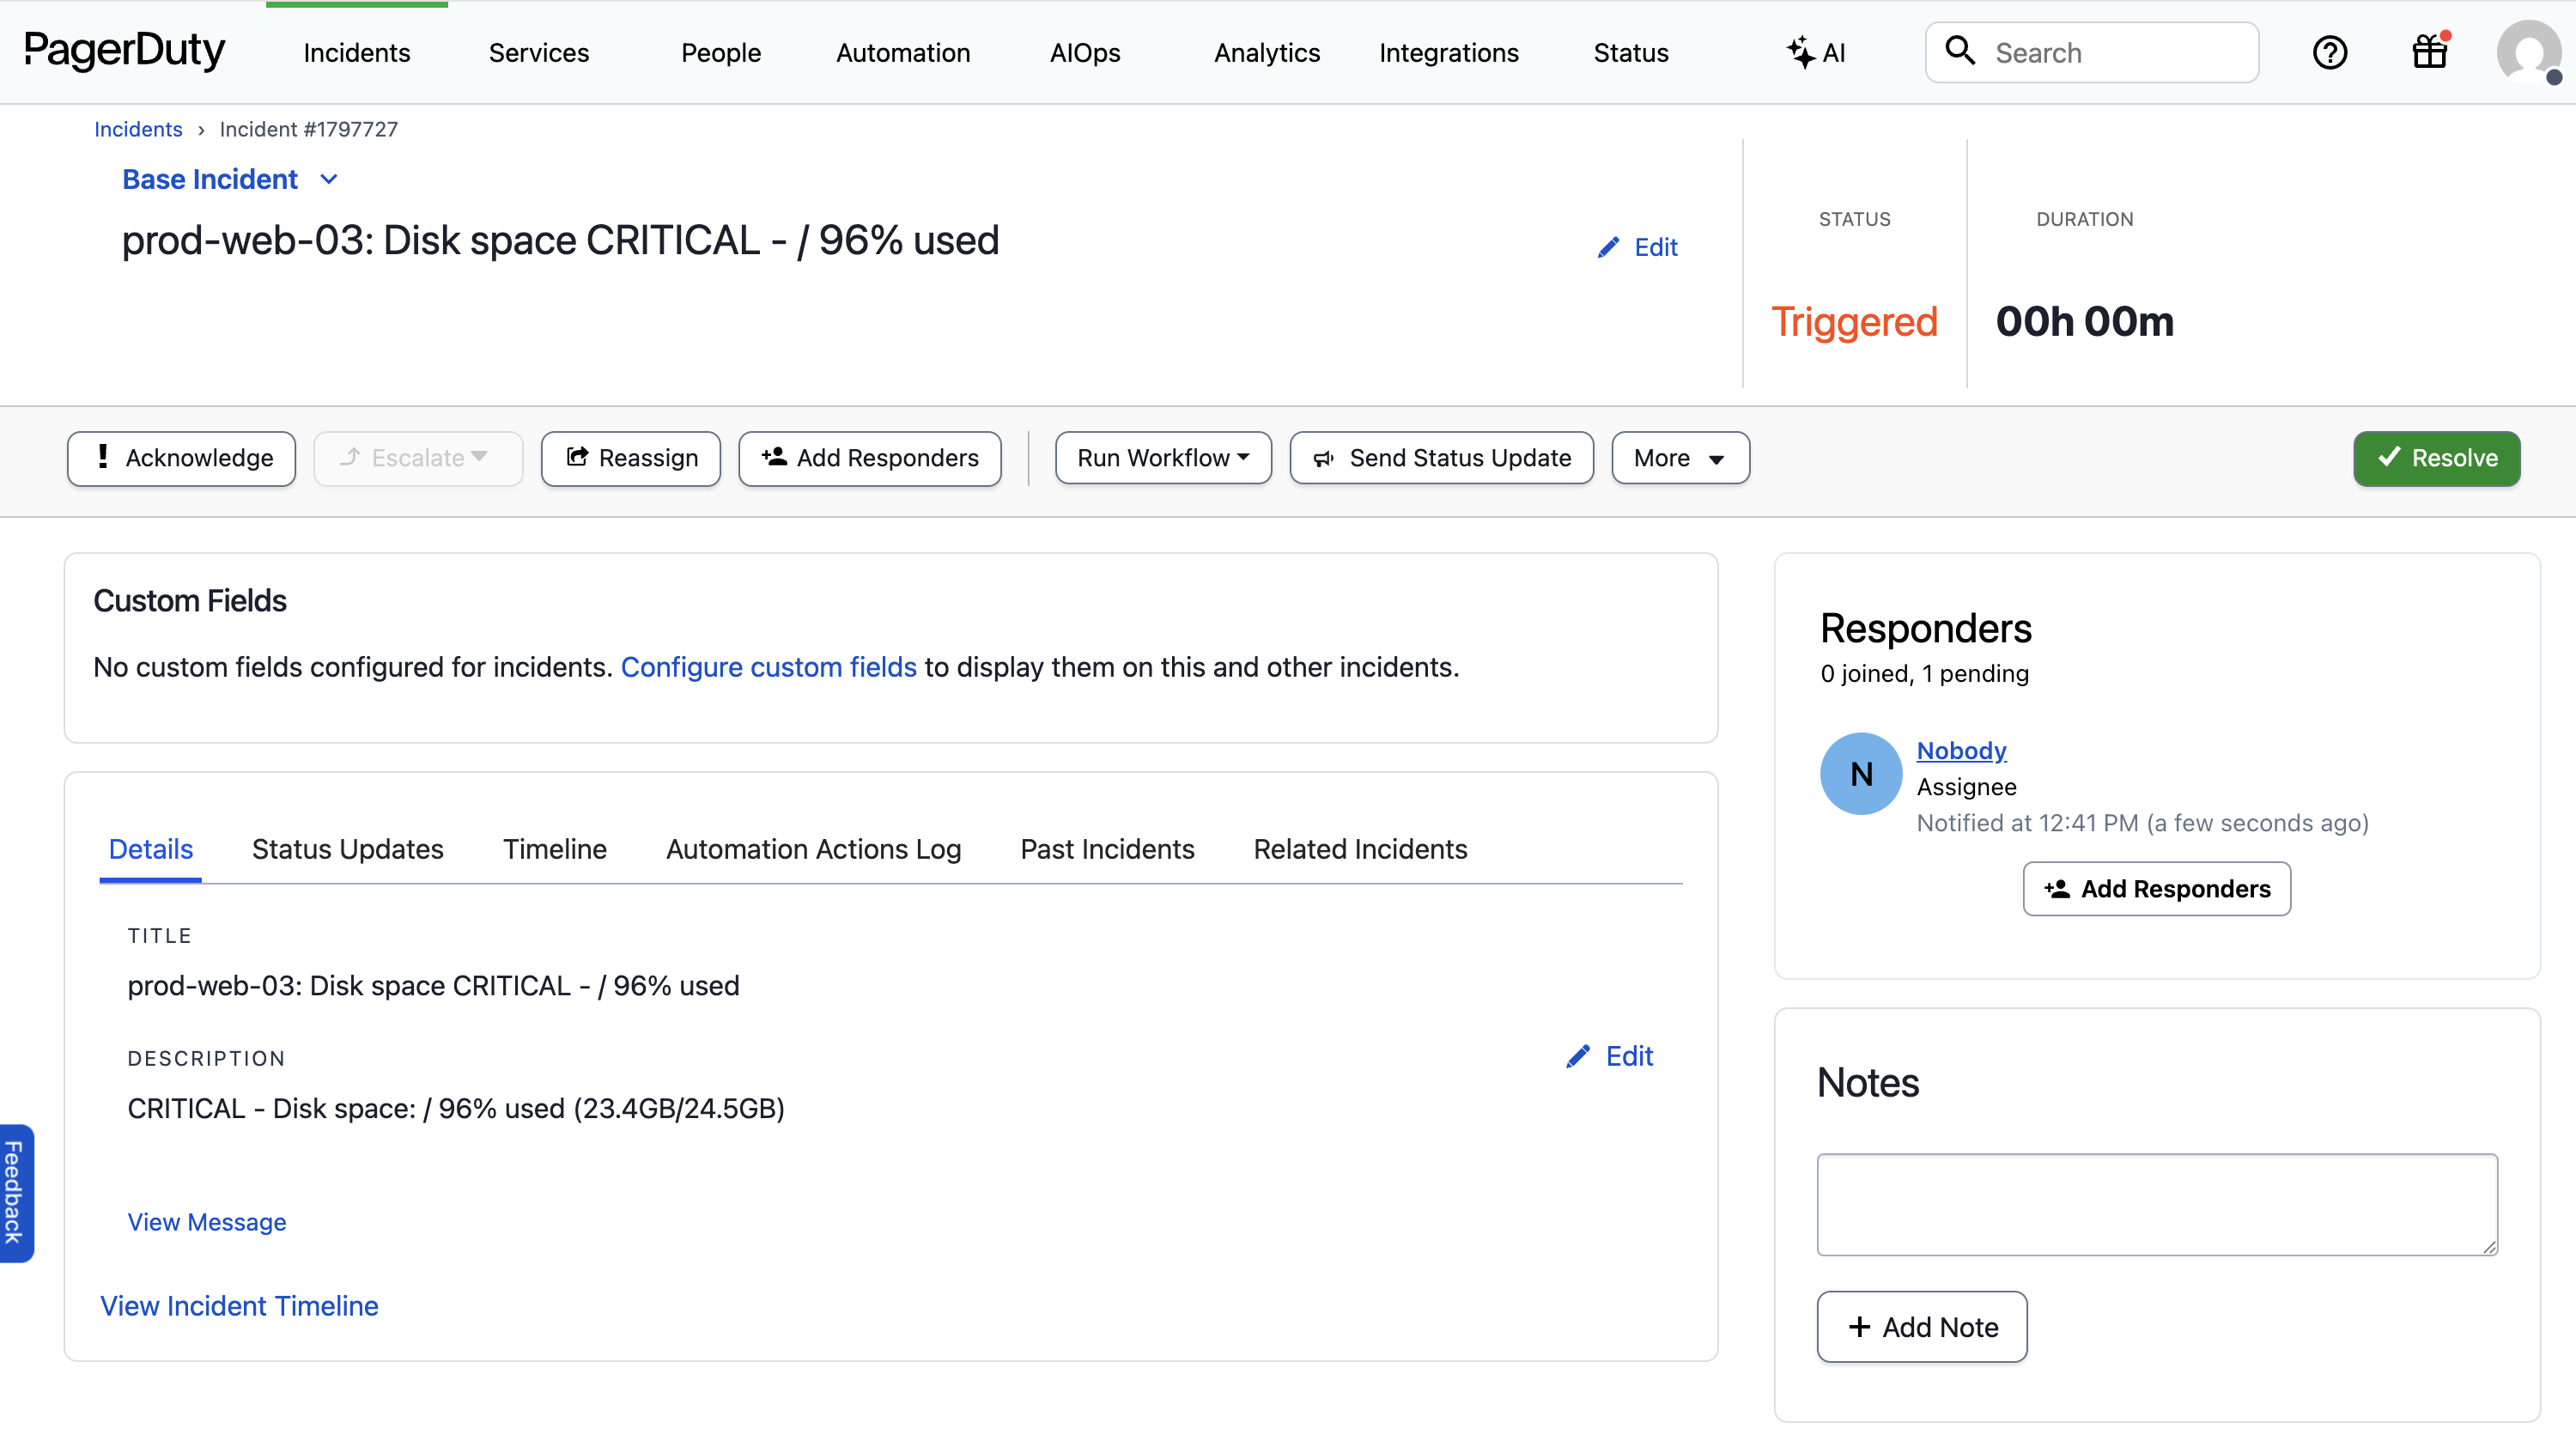
Creating A Disk Space Investigation Agent
Let’s create an Agent that runs every time we get a critical disk space alert in PagerDuty. Our Agent will grab the host from the alert, check disk usage remotely, identify the largest directories and files, and search recent logs for clues about what consumed the space. After installing Unpage, create the agent by running:$EDITOR. Paste the following Agent definition
into the file:
Description: When the agent should run
Thedescription of an Agent is used by the Router to
decide which Agent to run for a given input. In this example we want the Agent
to run only when the alert is about critical disk space issues.
Prompt: What the agent should do
Theprompt is where you give the Agent instructions, written in a runbook
format. Make sure any instructions you give are achievable using the tools
you have allowed the Agent to use (see below).
Tools: What the agent is allowed to use
Thetools section explicitly grants permission to use specific tools. You can
list individual tools, or use wildcards and regex patterns to limit what the
Agent can use.
To see all of the available tools your Unpage installation has access to, run:
shell_check_disk_space and shell_check_large_files,
which are custom shell commands that check disk usage and
identify large files on remote instances. Custom shell commands allow you to
extend the functionality of Unpage without having to write a new plugin.
Defining Custom Tools
To add our custom disk space investigation tools, edit~/.unpage/profiles/default/config.yaml
and add the following:
Running Your Agent
With your Agent configured and the custom disk space investigation tools added, we are ready to test it on a real PagerDuty alert.Testing on an existing alert
To test your Agent locally on a specific PagerDuty alert, run:Listening for webhooks
To have your Agent listen for new PagerDuty alerts as they happen, rununpage agent serve and add the webhook URL to your PagerDuty account:
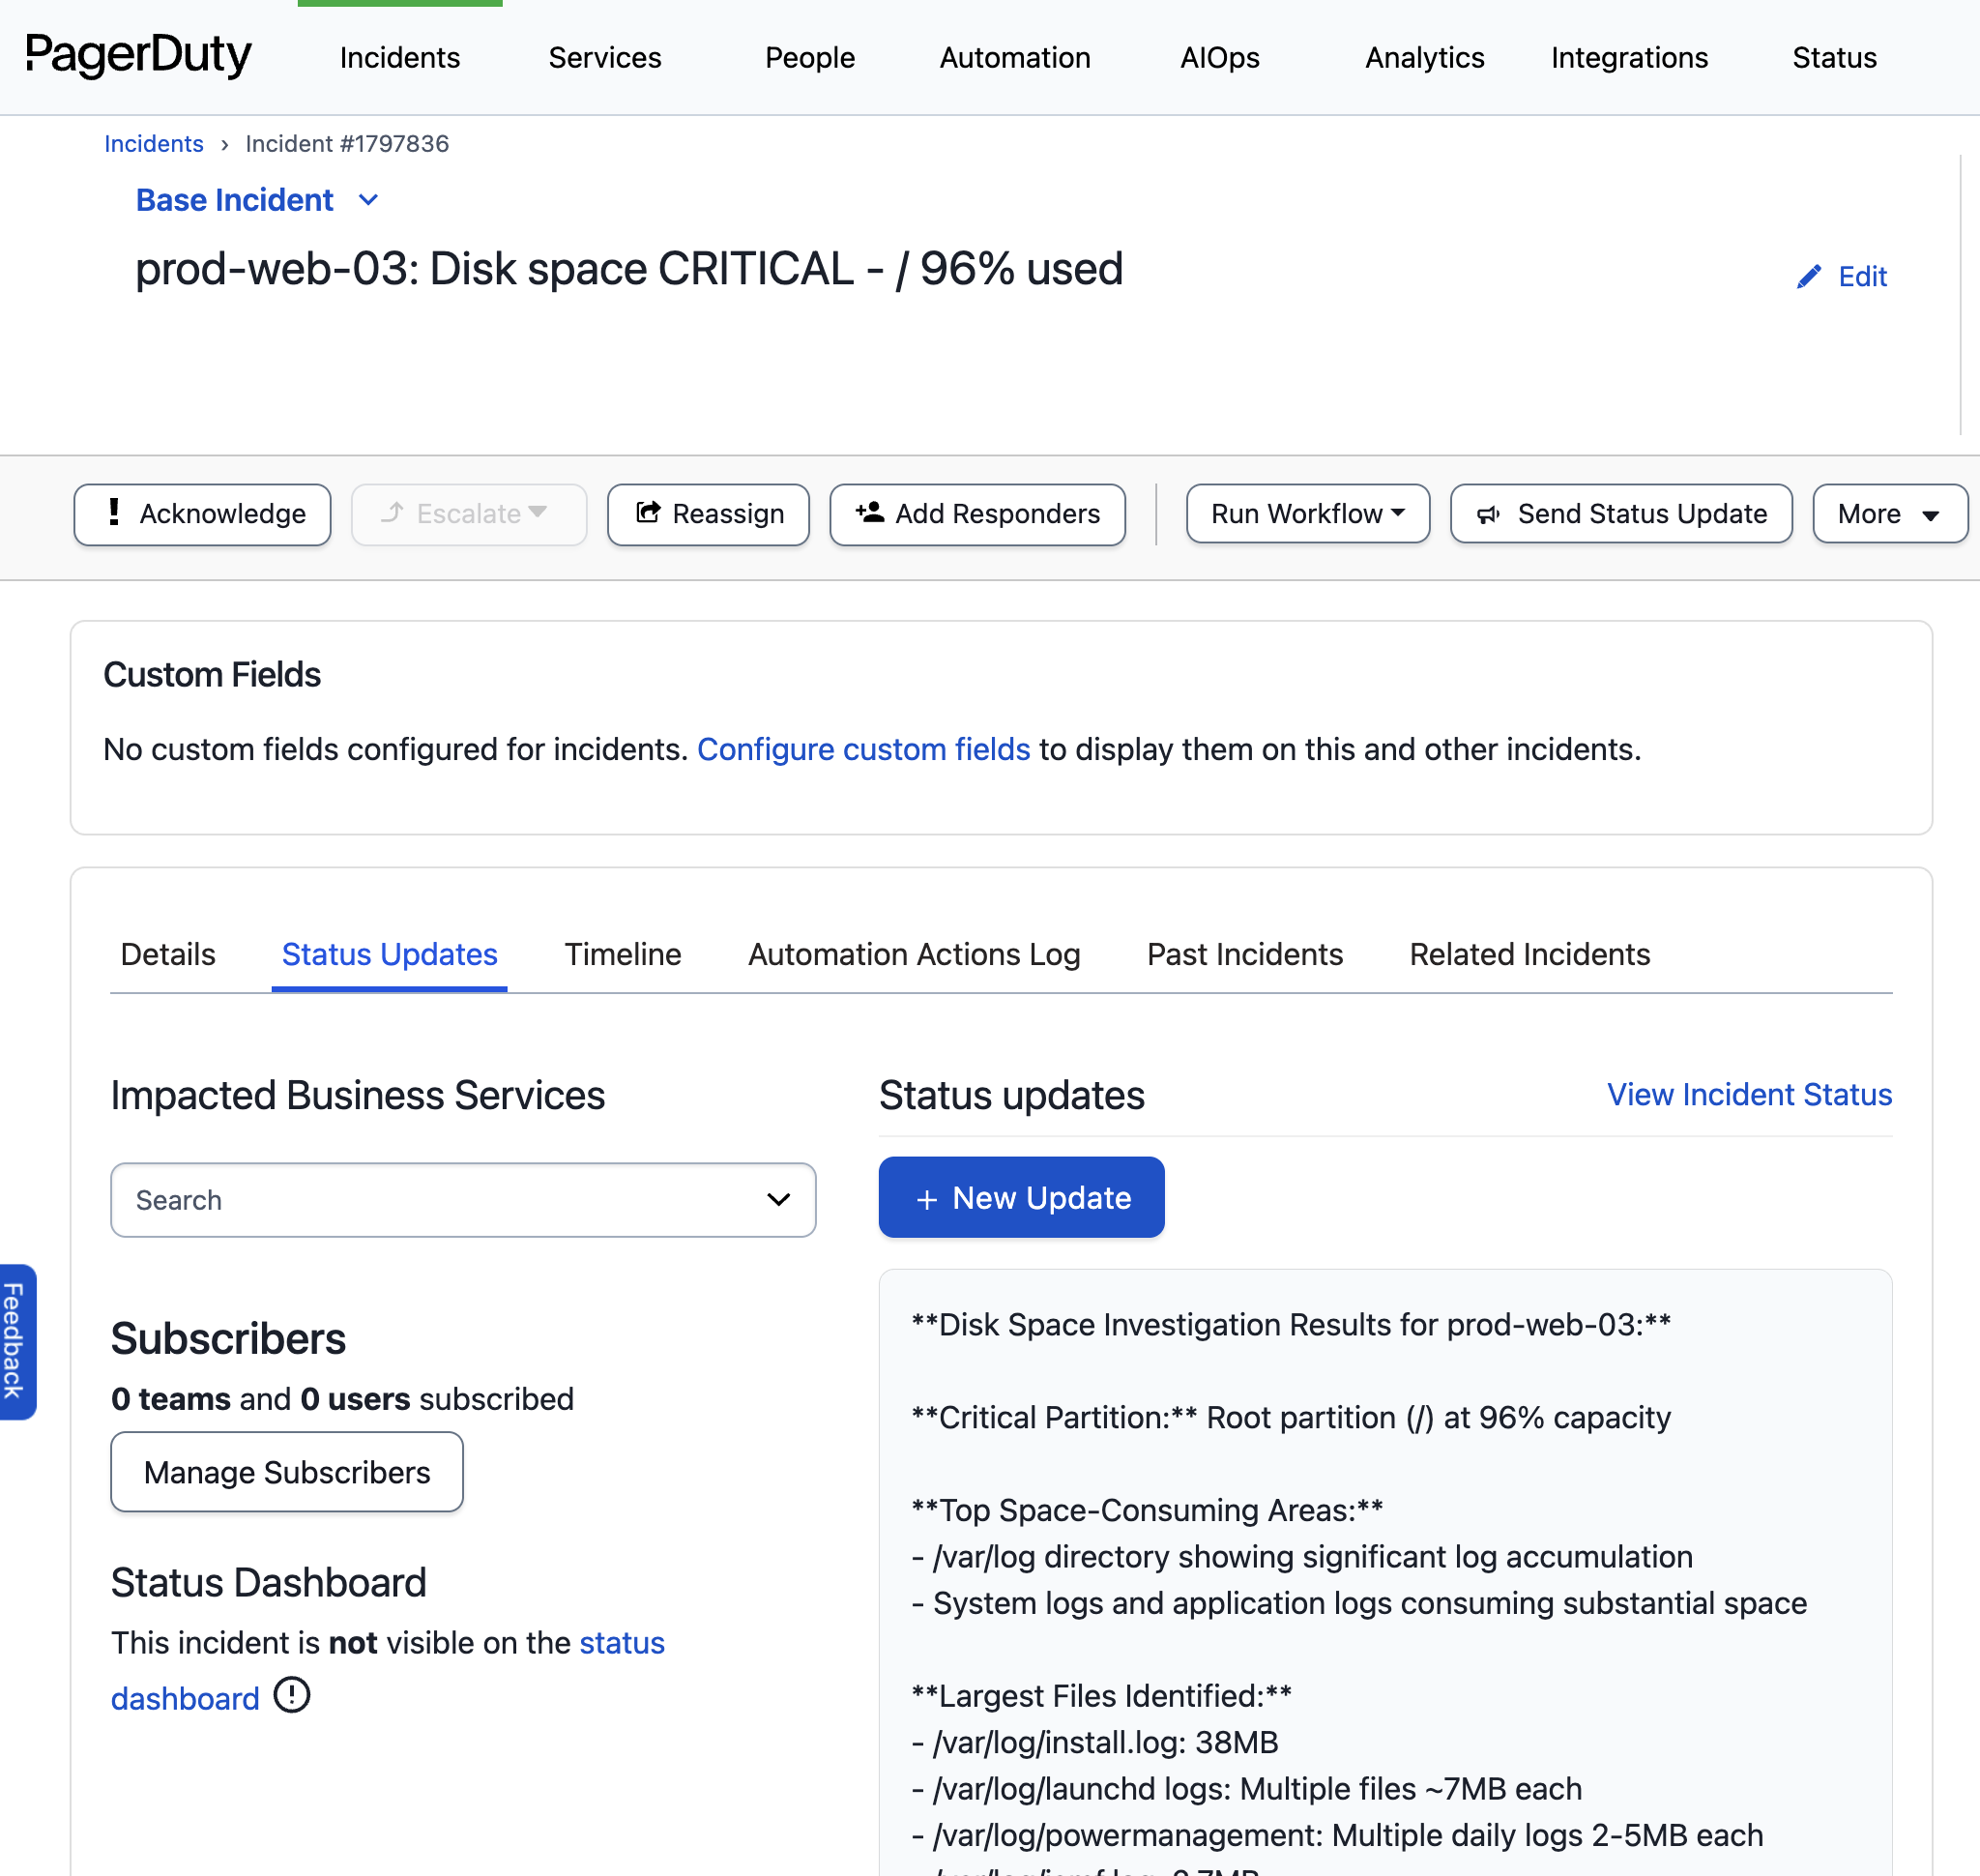
Example Output
Your Agent will update the PagerDuty alert with:- Current disk usage percentages for all partitions
- Top 20 directories consuming the most space
- Largest files in common problem directories (/var/log, /tmp, /var/lib/docker)
- Recent log entries from Papertrail indicating disk space warnings
- Actionable recommendations for immediate space cleanup